Showing posts with label read from URL. Show all posts

Monday, April 2, 2012

Example 9.25: It's been a mighty warm winter? (Plot on a circular axis)


Updated (see below)


People here in the northeast US consider this to have been an unusually warm winter. Was it?

The University of Dayton and the US Environmental Protection Agency maintain an archive of daily average temperatures that's reasonably current. In the case of Albany, NY (the most similar of their records to our homes in the Massachusetts' Pioneer Valley), the data set as of this writing includes daily records from 1995 through March 12, 2012.

In this entry, we show how to use R to plot these temperatures on a circular axis, that is, where January first follows December 31st. We'll color the current winter differently to see how it compares. We're not aware of a tool to enable this in SAS. It would most likely require a bit of algebra and manual plotting to make it work.

R
The work of plotting is done by the radian.plot() function in the plotrix package. But there are a number of data management tasks to be employed first. Most notably, we need to calculate the relative portion of the year that's elapsed through each day. This is trickier than it might be, because of leap years. We'll read the data directly via URL, which we demonstrate in Example 8.31. That way, when the unseasonably warm weather of last week is posted, we can update the plot with trivial ease.

library(plotrix)
temp1 = read.table("http://academic.udayton.edu/kissock/http/
Weather/gsod95-current/NYALBANY.txt")
leap = c(0,1,0,0,0,1,0,0,0,1,0,0,0,1,0,0,0,1)
days = rep(365, 18) + leap
monthdays = c(31,28,31,30,31,30,31,31,30,31,30,31)
temp1$V3 = temp1$V3 - 1994

The leap, days, and monthdays vectors identify leap years, count the corrrect number of days in each year, and have the number of days in the month in non-leap years, respectively. We need each of these to get the elapsed time in the year for each day. The columns in the data set are the month, day, year, and average temperature (in Fahrenheit). The years are renumbered, since we'll use them as indexes later.

The yearpart() function, below, counts the proportion of days elapsed.

yearpart = function(daytvec,yeardays,mdays=monthdays){
part = (sum(mdays[1:(daytvec[1]-1)],
(daytvec[1] > 2) * (yeardays[daytvec[3]]==366))
+ daytvec[2] - ((daytvec[1] == 1)*31)) / yeardays[daytvec[3]]
return(part)
}

The daytvec argument to the function will be a row from the data set. The function works by first summing the days in the months that have passed (,sum(mdays[1:(daytvec[1]-1)]) adding one if it's February and a leap year ((daytvec[1] > 2) * (yeardays[daytvec[3]]==366))). Then the days passed so far in the current month are added. Finally, we subtract the length of January, if it's January. This is needed, because sum(1:0) = 1, the result of which is that that January is counted as a month that has "passed" when the sum() function quoted above is calculated for January days. Finally, we just divide by the number of days in the current year.

The rest is fairy simple. We calculate the radians as the portion of the year passed * 2 * pi, using the apply() function to repeat across the rows of the data set. Then we make matrices with time before and time since this winter started, admittedly with some ugly logical expressions (section 1.14.11), and use the radian.plot() function to make the plots. The options to the function are fairly self-explanatory.

temp2 = as.matrix(temp1)
radians = 2* pi * apply(temp2,1,yearpart,days,monthdays)

t3old = matrix(c(temp1$V4[temp1$V4 != -99 & ((temp1$V3 < 18) | (temp1$V2 < 12))],
radians[temp1$V4 != -99 & ((temp1$V3 < 18) | (temp1$V2 < 2))]),ncol=2)

t3now= matrix(c(temp1$V4[temp1$V4 != -99 &
((temp1$V3 == 18) | (temp1$V3 == 17 & temp1$V1 == 12))],
radians[temp1$V4 != -99 & ((temp1$V3 == 18) |
(temp1$V3 == 17 & temp1$V1 == 12))]),ncol=2)
# from plottrix library
radial.plot(t3old[,1],t3old[,2],rp.type="s", point.col = 2, point.symbols=46,
clockwise=TRUE, start = pi/2, label.pos = (1:12)/6 * (pi),
labels=c("February 1","March 1","April 1","May 1","June 1",
"July 1","August 1","September 1","October 1","November 1",
"December 1","January 1"), radial.lim=c(-20,10,40,70,100))

radial.plot(t3now[,1],t3now[,2],rp.type="s", point.col = 1, point.symbols='*',
clockwise=TRUE, start = pi/2, add=TRUE, radial.lim=c(-20,10,40,70,100))

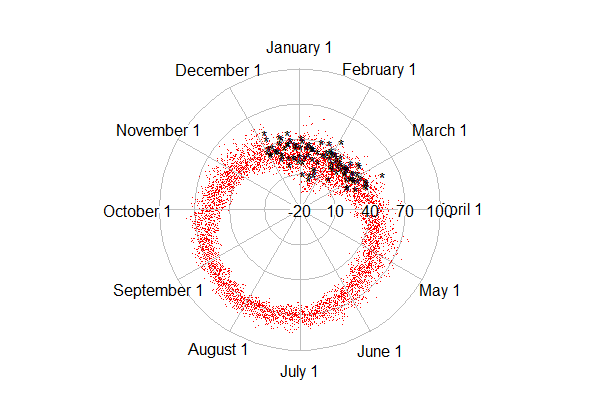
The result is shown at the top. The dots (point.symbol is like pch so 20 is a point (section 5.2.2) show the older data, while the asterisks are the current winter. An alternate plot can be created with the rp.type="p" option, which makes a line plot. The result is shown below, but the lines connecting the dots get most of the ink and are not what we care about today.

Either plot demonstrates clearly that a typical average temperature in Albany is about 60 to 80 in August and about 10 to 35 in January, the coldest monthttp://www.blogger.com/img/blank.gifh.

Update
The top figure shows that it has in fact been quite a warm winter-- most of the black asterisks are near the outside of the range of red dots. Updating with more recent weeks will likely increase this impression. In the first edition of this post, the radial.lim option was omitted, which resulted in different axes in the original and "add" calls to radial.plot. This made the winter look much cooler. Many thanks to Robert Allison for noticing the problem in the main plot. Robert has made many hundreds of beautiful graphics in SAS, which can be found here. He also has a book. Robert also created a version of the plot above in SAS, which you can find here, with code here. Both SAS and R (not to mention a host of other environments) are sufficiently general and flexible that you can do whatever you want to do-- but varying amounts of expertise might be required.

An unrelated note about aggregators
We love aggregators! Aggregators collect blogs that have similar coverage for the convenience of readers, and for blog authors they offer a way to reach new audiences. SAS and R is aggregated by R-bloggers and PROC-X with our permission, and by at least 2 other aggregating services which have never contacted us. If you read this on an aggregator that does not credit the blogs it incorporates, please come visit us at SAS and R. We answer comments there and offer direct subscriptions if you like our content. In addition, no one is allowed to profit by this work under our license; if you see advertisements on this page, the aggregator is violating the terms by which we publish our work.

Thursday, January 5, 2012

Example 9.18: Constructing the fastest relay team via enumeration

In competitive swimming, the medley relay is a team event in which four different swimmers each swim one of the four strokes: freestyle, breaststroke, backstroke, and butterfly. In general, every swimmer might be able swim any given stroke. How can we choose the fastest relay team? Here we solve this by enumerating all possible teams, though a more efficient routine likely exists.

Some example practice times can be seen on this Google Spreadsheet. Also, using the steps outlined here, the same spreadsheet is available as a CSV file here. (FTR, these are actual practice times for 100 yards for mostly 12-13 year-old swimmers; the names have been changed.)


SAS
We first read the data from the URL, using the technique outlined in section 1.1.6. Note that if you cut-and-paste this, you'll need to get the whole URL onto one line-- we break it up here for display only.

filename swimurl url 'https://docs.google.com/spreadsheet
/pub?key=0AvJKgZUzMYLYdE5xTHlEWkNUM3NoOHB1ZTJoTFMzUUE&
single=true&gid=0&output=csv';

proc import datafile=swimurl out=swim dbms=csv;
run;

Next, we use the point= option in nested set statements to generate a single data set with all the possible combinations of names and times. Meanwhile we change the names of the variables so they don't get overwritten in the next set statement. Note the use of the nobs option to find the number of rows in the data set.

data permute
(keep=free freetime fly flytime back backtime breast breasttime);
set swim (rename = (swimmer=free freestyle=freetime)) nobs=nobs;
do i = 1 to nobs;
set swim(rename = (swimmer=fly butterfly=flytime)) point=i;
do j = 1 to nobs;
set swim(rename = (swimmer=back backstroke=backtime)) point=j;
do k = 1 to nobs;
set swim(rename = (swimmer=breast breaststroke=breasttime))
point = k;
output;
end;
end;
end;
run;

The resulting data set has 12^4 rows, and includes rosters with the same swimmer swimming all four legs. In fact, a quick glance will show that Anna has the best time in each stroke, and thus the best "team" based on these practice times would use her for each stroke. This is against the rules, and also probably isn't reflective of performance in a race. We'll remove illegal line-ups using a where statement (section 1.5.1) and also calculate the total team time.

data prep;
set permute;
where free ne back and free ne breast and free ne fly and
back ne breast and back ne fly and breast ne fly;
time = sum(freetime, flytime, backtime, breasttime);
run;

The resulting data set has (12 permute 4) lines. To find the best team, we just sort by the total time and look at the first line. Here the first 10 lines (10 best teams) are shown.

proc sort data=prep; by time; run;
proc print data=prep (obs=10); run;

b
r
f b e
r f a a
e l c b s
e y k r t
f t t b t e t t
r i f i a i a i i
e m l m c m s m m
e e y e k e t e e

Kara 109.3 Dora 126.8 Lara 117.7 Anna 126.9 480.7
Anna 102.8 Dora 126.8 Lara 117.7 Beth 134.6 481.9
Kara 109.3 Anna 120.5 Lara 117.7 Beth 134.6 482.1
Anna 102.8 Dora 126.8 Lara 117.7 Honora 136.4 483.7
Kara 109.3 Jane 129.8 Lara 117.7 Anna 126.9 483.7
Kara 109.3 Anna 120.5 Lara 117.7 Dora 136.4 483.9
Kara 109.3 Anna 120.5 Lara 117.7 Honora 136.4 483.9
Kara 109.3 Lara 123.1 Jane 124.7 Anna 126.9 484.0
Anna 102.8 Dora 126.8 Lara 117.7 Inez 136.8 484.1
Carrie 112.7 Dora 126.8 Lara 117.7 Anna 126.9 484.1

The best time shaves a whole second off the predicted time using the second-best team.

R
Since published Google Spreadsheets use https rather than http, we use the RCurl package and its getURL() function. (Note that if you cut-and-paste this, you'll need to get the whole URL onto one line-- we break it up here for display only.) Then we can read the data with read.csv() and textConnection().

library(RCurl)
swim = getURL("https://docs.google.com/spreadsheet
/pub?key=0AvJKgZUzMYLYdE5xTHlEWkNUM3NoOHB1ZTJoTFMzUUE&
single=true&gid=0&output=csv")

swim2=read.csv(textConnection(swim))

To make an object with the combinations of names, we use the expand.grid() function highlighted in Example 7.22, providing as arguments the swimmers names four times. As in the SAS example, the result has has 12^4 rows. The combn() function might be a better fit here, but was more difficult to use.

test2 = expand.grid(swim2$Swimmer,swim2$Swimmer, swim2$Swimmer, swim2$Swimmer)

It'll be useful to assign these copies of the names to each of the strokes. We'll do that with the rename() function available in the reshape package. (This approach is mentioned in section 1.3.4.). Then we can remove the rows where the same name appears twice using some logic. The logic is nested in the with() function to save some keystrokes and is generally preferable to attach()ing the test2 object.

library(reshape)
test2 = rename(test2, c("Var1" = "free", "Var2" = "fly",
"Var3" = "back", "Var4" = "breast"))
test3 = with(test2, test2[(free != breast) & (free != fly)
& (free != back) & (breast != fly) & (breast != back)
& (fly != back) ,])

Finally, we can use the which.min() function to pick the best team.

> bestteam =
+ test3[which.min(swim2$Freestyle[test3$free]+swim2$Breaststroke[test3$breast] +
+ swim2$Butterfly[test3$fly] + swim2$Backstroke[test3$back]),]
>bestteam
free fly back breast
1631 Kara Dora Lara Anna

For new users of R, this may look very peculiar-- it uses elegant but powerful features of the R language that may be challenging for new users to grasp. Essentially, in swim2$Freestyle[test3$free] we say: from the "freestyle" times in the swim2 object, take the time from the row that has the name in a row of "free" names in the test3 object. The which.min() function replicates this request for every row in the test3 object (which has all of the permutations) in it, returning the row number with that minimum sum. The outer test3[rows,columns] syntax grabs the values in this row. (The number 1631 is the row number, for some reason showing the row in the test2 object created by expand.grid().)

Now, we might also want the actual times associated with the best team. We can find them by calling the correct rows (names from the best team) and columns (stroke associated with that name) from the original data set.

> times = c(swim2[swim2$Swimmer == bestteam$free,2],
+ swim2[swim2$Swimmer == bestteam$fly,3],
+ swim2[swim2$Swimmer == bestteam$back,4],
+ swim2[swim2$Swimmer == bestteam$breast,5])
> times
[1] 109.3 126.8 117.7 126.9

If instead, one wanted to list the times in order, one approach would be to add columns to the test3 object with the time for each stroke, calculate their sum, and sort on the sum.

Tuesday, April 19, 2011

Example 8.35: Grab true (not pseudo) random numbers; passing API URLs to functions or macros

Usually, we're content to use a pseudo-random number generator. But sometimes we may want numbers that are actually random-- an example might be for randomizing treatment status in a randomized controlled trial.

The site Random.org provides truly random numbers based on radio static. For long simulations, its quota system may prevent its use. But for small to moderate needs, it can be used to provide truly random numbers. In addition, you can purchase larger quotas if need be.

The site provides APIs for several types of information. We'll write functions to use these to pull vectors of uniform (0,1) random numbers (of 10^(-9) precision) and to check the quota. To generate random variates from other distributions, you can use the inverse probability integral transform (section 1.10.8).

The coding challenge here comes in integrating quotation marks and special characters with function and macro calls.

SAS
In SAS, the challenging bit is to pass the desired number of random numbers off to the API, though the macro system. This is hard because the API includes the special characters ?, ", and especially &. The ampersand is used by the macro system to denote the start of a macro variable, and is used in APIs to indicate that an additional parameter follows.

To avoid processing these characters as part of the macro syntax, we have to enclose them within the macro quoting function %nrstr. We use this approach twice, for the fixed pieces of the API, and between them insert the macro variable that contains the number of random numbers desired. Also note that the sequence %" is used to produce the quotation mark. Then, to unmask the resulting character string and use it as intended, we %unquote it. Note that the line break shown in the filename statement must be removed for the code to work.

Finally, we read data from the URL (section 1.1.6) and transform the data to take values between 0 and 1.

%macro rands (outds=ds, nrands=);
filename randsite url %unquote(%nrstr(%"http://www.random.org/integers/?num=)
&nrands%nrstr(&min=0&max=1000000000&col=1&base=10&format=plain&rnd=new%"));
proc import datafile=randsite out = &outds dbms = dlm replace;
getnames = no;
run;

data &outds;
set &outds;
var1 = var1 / 1000000000;
run;
%mend rands;

/* an example macro call */
%rands(nrands=25, outds=myrs);

The companion macro to find the quota is slightly simpler, since we don't need to insert the number of random numbers in the middle of the URL. Here, we show the quota in the SAS log; the file print syntax, shown in Example 8.34, can be used to send it to the output instead.

%macro quotacheck;
filename randsite url %unquote(%nrstr(%"http://www.random.org/quota/?format=plain%"));
proc import datafile=randsite out = __qc dbms = dlm replace;
getnames = no;
run;

data _null_;
set __qc;
put "Remaining quota is " var1 "bytes";
run;
%mend quotacheck;

/* an example macro call */
%quotacheck;


R

Two R functions are shown below. While the problem isn't as difficult as in SAS, it is necessary to enclose the character string for the URL in the as.character() function (section 1.4.1).

truerand = function(numrand) {
read.table(as.character(paste("http://www.random.org/integers/?num=",
numrand, "&min=0&max=1000000000&col=1&base=10&format=plain&rnd=new",
sep="")))/1000000000
}

quotacheck = function() {
line = as.numeric(readLines("http://www.random.org/quota/?format=plain"))
return(line)
}

Monday, November 1, 2010

Example 8.12: Bike ride plot, part 1


The iPhone app Cyclemeter uses the phone's GPS capability to record location and other data, and infer speed, while you ride. I took a ride near my house recently, and downloaded the data. I'd like to examine my route and my speed. A simple plot of the route is trivial in either SAS or R, but adding the speed data requires a little work. You can download my data from here and I read the data directly via URL in the following code.

SAS

In SAS, I first use proc import with the url filetype, as shown in section 1.1.6. I can then make a simple plot of the route using the i=j option to the symbol statement (as in section 1.13.5), which simply joins successive points.

filename bike url 'http://www.kenkleinman.net/files/cycle-data-10022010.csv';

proc import datafile=bike out=ride dbms=dlm;
delimiter=',';
getnames=yes;
run;

symbol1 i=j;
proc gplot data=ride;
plot latitude * longitude;
run;


I didn't project the data, so this looks a little compressed north-south.

To show my speed at each point, I decided to make a thicker line when I'm going faster. To do this, I use the annotate macros discussed in section 5.2. I decided to use the %line macro to do this, but that requires each observation in the data set have a starting point and an ending point for its section of line. I use the lag function (section 1.4.17) in a separate data step to add the previous point to each observation. Then I create the annotate data set. Finally, I use the value = none option to the symbol statement to make an empty plot and the annotate data set draws the line for me.


data twopoints;
set ride;
lastlat = lag(latitude);
lastlong = lag(longitude);
if _n_ ne 1;
run;

%annomac;
data annoride;
set twopoints;
%system(2,2,6);
%line(longitude,latitude,lastlong,lastlat,
black,1,speed__miles_h_);
run;

symbol1 v=none;
proc gplot data=ride;
plot latitude * longitude / annotate=annoride;;
run;
quit;

The resulting plot shown below closely resembles the R plot shown at the top of this entry.


R

In R, it's as trivial to make the simple plot as in SAS. Just read in the CSV data from the URL (section 1.1.2, 1.1.6) make an empty plot (5.1.1), and add the lines (5.2.1).

myride=read.csv("http://www.kenkleinman.net/files/cycle-data-10022010.csv")
attach(myride)
plot(Longitude, Latitude, type="n")
lines(Longitude, Latitude)


Now I want to show the speed, as above. The lines() function has a lwd= option, but unfortunately, it's not vectorized. In other words, it accepts only a scalar that applies to all the line segments drawn in a given call. To get around that, I'll write my own vectorized version of lines() using the disfavored for() function. It calls lines() for each pair of points, with an appropriate lwd value.

veclines = function(x, y, z) {
for (i in 1:(length(x)-1)) {
lines(x[i:(i+1)], y[i:(i+1)], lwd=z[i])
}
}
veclines(Longitude, Latitude, Speed..miles.h./2)

The result is displayed at the top of this blog entry. In the next entry we'll add more information to help explain why the speed varies.

Saturday, August 1, 2009

Example 7.8: Plot two empirical cumulative density functions using available tools

The empirical cumulative density function (CDF) (section 5.1.16) is a useful way to compare distributions between populations. The Kolmogorov-Smirnov (section 2.4.2) statistic D is the value of x with the maximum distance between the two curves. As an example, we compare the male and female distributions of pcs from the HELP data set described in the book. Here, we use built-in tools to plot the graph; in later entries we will build it from scratch for greater control.

We begin by reading in the data (section 1.1.14) as a comma separated file from the book web site (section 1.1.6).

SAS

filename myurl
url 'http://www.math.smith.edu/sasr/datasets/help.csv'
lrecl=704;

proc import
datafile=myurl out=ds dbms=dlm;
delimiter=',';
getnames=yes;
run;

SAS proc univariate can do this plot automatically (section 5.1.15). It is designed to compare two groups within the data set, using the class statement (section 3.1.3).


proc univariate data=ds;
var pcs;
class female;
cdfplot pcs / overlay;
run;


In R, the plot() function accepts ecdf() objects (section 5.1.15) as input. Applying this to pcs, conditional on including only the rows when female is 1 (section B.4.2) creates the first empirical CDF as well as the axes. The lines() function (section 5.2.1) also accepts ecdf() objects as input, and applying this to pcs when female is 0 adds the second empirical CDF to the existing plot. A legend (section 5.2.14) is added to show which curve is which. (Note that the Blogger software prevents displaying this image large enough to see the difference here, but it will be visible when run locally.

R

> ds <- read.csv(
"http://www.math.smith.edu/sasr/datasets/helpmiss.csv")
> attach(ds)
> plot(ecdf(pcs[female==1]), verticals=TRUE, pch=46)
> lines(ecdf(pcs[female==0]), verticals=TRUE, pch=46)
> legend(20, 0.8, legend=c("Women", "Men"), lwd=1:3)


Click the graphic below for a more legible image of the output.


Monday, July 20, 2009

Example 7.6: Find Amazon sales rank for a book

In honor of Amazon's official release date for the book, we offer this blog entry.

Both SAS and R can be used to find the Amazon Sales Rank for a book by downloading the desired web page and ferreting out the appropriate line. This code is likely to break if Amazon’s page format is changed (but it worked as of October, 2010). [Note: as of spring 2010 Amazon changed the format for their webpages, and the appropriate text to search for changed from "Amazon.com Sales Rank" to "Amazon Bestsellers Rank". We've updated the blog code with this string. As of October 9, 2010 they added a number of blank lines to the web page, which we also now address.]

In this example, we find the sales rank for our book. Some interesting information about interpreting the rank can be found here or here.

Both SAS and R code below rely on section 1.1.3, ”Reading more complex text files.” Note that in the displayed SAS and R code, the long URL has been broken onto several lines, while it would have to be entered on a single line to run correctly.


In SAS, we assign the URL an internal name (section 1.1.6), then input the file using a data step. We exclude all the lines which don’t contain the sales rank, using the count function (section 1.4.6). We then extract the number using the substr function (section 1.4.3), with the find function (section 1.4.6) employed to locate the number within the line. The last step is to turn the extracted text (which contains a comma) into a numeric variable.

SAS

filename amazon url "http://www.amazon.com/
SAS-Management-Statistical-Analysis-Graphics/
dp/1420070576/ref=sr_1_1?ie=UTF8&s=books
&qid=1242233418&sr=8-1";

data test;
infile amazon truncover;
input @1 line $256.;
if count(line, "Amazon Bestsellers Rank") ne 0;
rankchar = substr(line, find(line, "#")+1,
find(line, "in Books") - find(line, "#") - 2);
rank = input(rankchar, comma9.);
run;

proc print data=test noobs;
var rank;
run;


R

# grab contents of web page
urlcontents <- readLines("http://www.amazon.com/
SAS-Management-Statistical-Analysis-Graphics/
dp/1420070576/ref=sr_1_1?ie=UTF8&s=books
&qid=1242233418&sr=8-1")
# find line with sales rank
linenum <- suppressWarnings(grep("Amazon Bestsellers Rank:",
urlcontents))

newline = linenum + 1 # work around October 2010 blank spaces
while (urlcontents[newline] == "") {
newline = newline + 1
}

# split line into multiple elements
linevals <- strsplit(urlcontents[newline], ' ')[[1]]

# find element with sales rank number
entry <- grep("#", linevals)
# snag that entry
charrank <- linevals[entry]
# kill '#' at start
charrank <- substr(charrank, 2, nchar(charrank))
# remove commas
charrank <- gsub(',','', charrank)
# turn it into a numeric opject
salesrank <- as.numeric(charrank)
cat("salesrank=",salesrank,"\n")


The resulting output (on July 16, 2009) is

SAS

rank

23476


R

salesrank= 23467